
Monitor Your Digital Marketing Performance in One Excel Dashboard
Do you need to track your marketing KPIs, goals, and results all in one place?
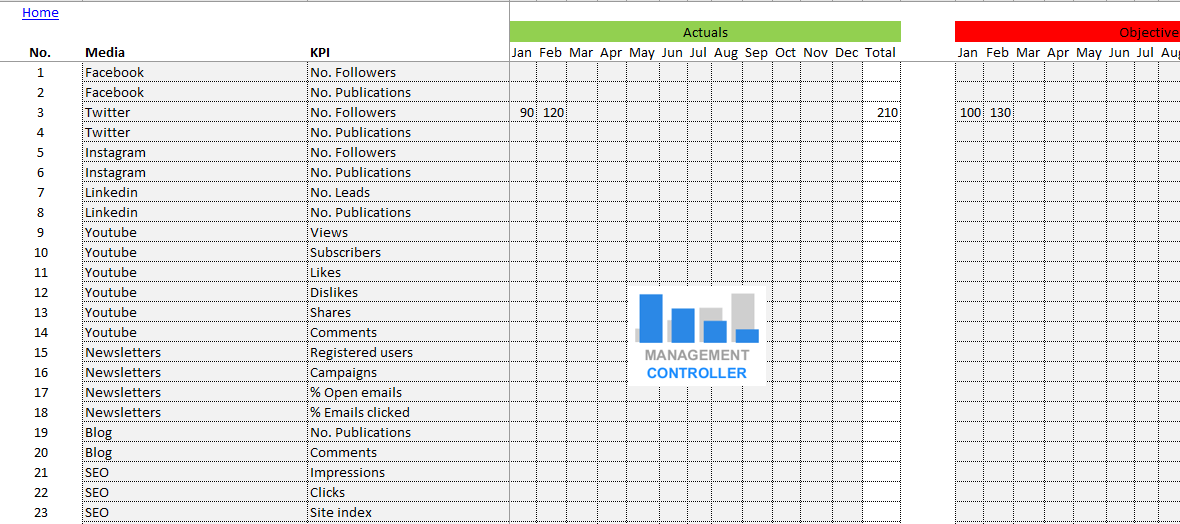
The Free Excel Digital Marketing Dashboard is a powerful and customizable spreadsheet designed to help you analyze your marketing performance across multiple channels — from social media to SEO, newsletters, and Google Analytics.
This free and open Excel template allows you to assign monthly targets, record actual results, and instantly compare performance vs. objectives to identify what’s working and where to improve.
What You Can Do with This Digital Marketing Dashboard
📊 Set monthly goals and track progress across all major marketing platforms
💡 Compare actual data vs. objectives automatically
📈 Analyze key metrics and identify trends
⚙️ Customize KPIs according to your strategy or campaigns
The dashboard gives you a complete overview of your marketing activity — whether you’re managing social media, SEO, paid ads, or content strategy.
Included Digital Marketing KPIs
The Excel example comes preloaded with the most relevant digital marketing indicators, grouped by channel:
📱 Social Media
-
Followers
-
Publications
-
Followers
-
Publications
-
Followers
-
Publications
-
Leads
-
Publications
🎥 YouTube
-
Views
-
Subscribers
-
Likes
-
Dislikes
-
Shares
-
Comments
📧 Email & Newsletters
-
Registered users
-
Campaigns sent
-
% Emails opened
-
% Emails clicked
📝 Blog
-
Publications
-
Comments
🔍 SEO
-
Impressions
-
Clicks
-
Indexed sites
-
URLs sent
-
URLs indexed
📊 Google Analytics
-
Users
-
Sessions
-
Pages per session
-
Source/medium & channels
-
Pageviews and unique pageviews
-
Average time on page
-
Bounce rate
Traffic Sources (segmented by channel):
-
Organic
-
SEM
-
Direct
-
LinkedIn
-
Facebook
-
Twitter
-
YouTube
💰 Sales
-
Total revenues
This structure provides a 360º view of your digital ecosystem, helping you evaluate performance by source, channel, and objective.
Why Use This Excel Template
✅ 100% Free and fully editable
✅ Covers all major marketing KPIs
✅ Helps set and compare monthly goals
✅ Ideal for marketing managers, freelancers, and digital agencies
✅ Easy to customize, update, and expand
✅ Compatible with Google Analytics, SEO, and social media data exports
Download the Free Excel Digital Marketing Dashboard
Gain full control over your digital marketing performance.
Download the Free Excel Dashboard for Digital Marketing, define your goals, and make data-driven decisions that grow your brand.
👉 Get it now

More information about Controlling Tools
- Suppliers Prices Comparative Analysis Free Excel Template – Compare Supplier Prices and Optimize Purchasing Decisions
- Customer Invoices Free Excel Template – Create, Print & Manage Up to 500 Invoices Automatically
- Financial Plan M3 Free Excel Template – Build a Solid Financial Model for Your Business Project
- Cost Product BOM Components Example Excel Spreadsheet – Calculate Product Manufacturing Costs Accurately
- Excel Budget BOM Manufacturing Costs and Margins M15 – Forecast and Control of Industrial Profitability
- Wedding Budget Control M1 Free Excel Template – Plan and Track Your Wedding Expenses Easily
- Direct Costing Free Excel Template – Variable Costing and Profitability Analysis
- New Investments Requests Form Free Excel Template – Manage and Approve Your Company’s Investment Proposals
- Training Courses Control Free Excel Template – Track Employee Training, Costs, and Performance
- Retail Commerce Profit Analysis Free Excel Template – Calculate Your Store’s Profitability Easily
- Pickleball and Padel Sport Club Profit Analysis Free Excel Template – Evaluate the Profitability of Your Sports Club Investment
- Control and Justification of Commercial Expenses – Free Excel Template
- Business Plan Budget 5 Years M1 Free Excel Template – Long-Term Financial Planning Made Simple
- Documents Management Free Excel Template M1 – Organize and Track Your Company Files Efficiently
- Budget Sales Control Free Excel Template – Create and Analyze Your Product Sales Budget Easily
- Balanced Scorecard M1 Excel Template – Strategic Management and KPI Control System
- Excel Manufacturing Standard Costs and Margins M10 – Forecast Costing and Profitability Planning
- Restaurant Sales Forecast Free Excel Template – Plan Menus, Costs, and Profit Margins Easily
- Employee Management Free Excel Template – Complete HR Control System for Small Businesses
- Marketing Plan Free Excel Template – Plan, Budget, and Track Your Marketing Actions
- Action Planning Free Excel Template – From Strategy to Execution
- KPI OEE Report Excel Free Template – Measure and Improve Manufacturing Efficiency
ERP ODOO Functional Consultant and Controller (Management Control & Controlling)
