KPI OEE Report Excel Free Template.
Do you need a OEE report (Overall Equipment Effectiveness or General Equipment Efficiency) performed with Excel spreadsheets? This is your place.
And you can get it for FREE.
Up to 50 products to be manufactured and up to 10 manufacturing lines or equipment can be registered in the template.
For each workstation line or manufacturing equipment, the theoretical production per hour must be recorded, that is, the units that can be produced in an estimation per hour in each line for each product.
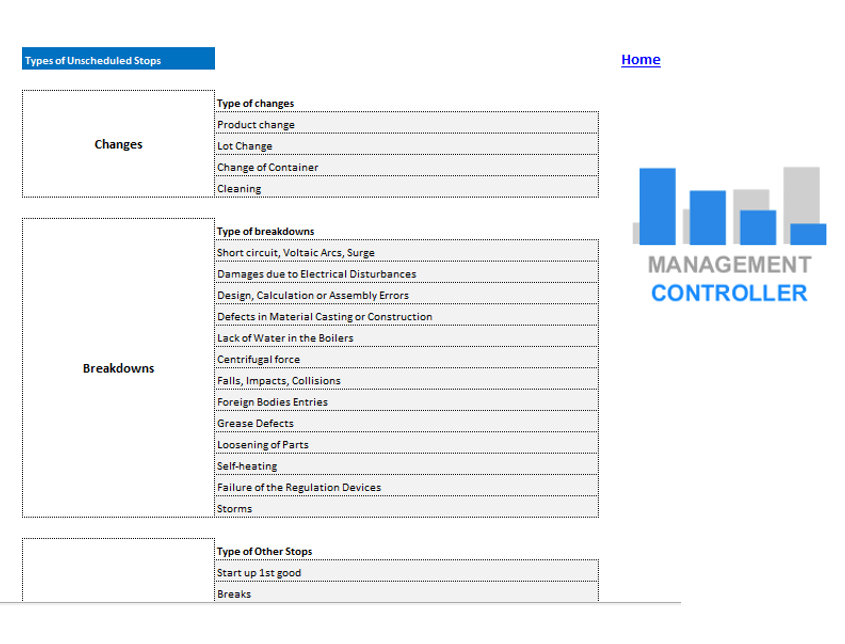
There is a predefined list of stoppages.
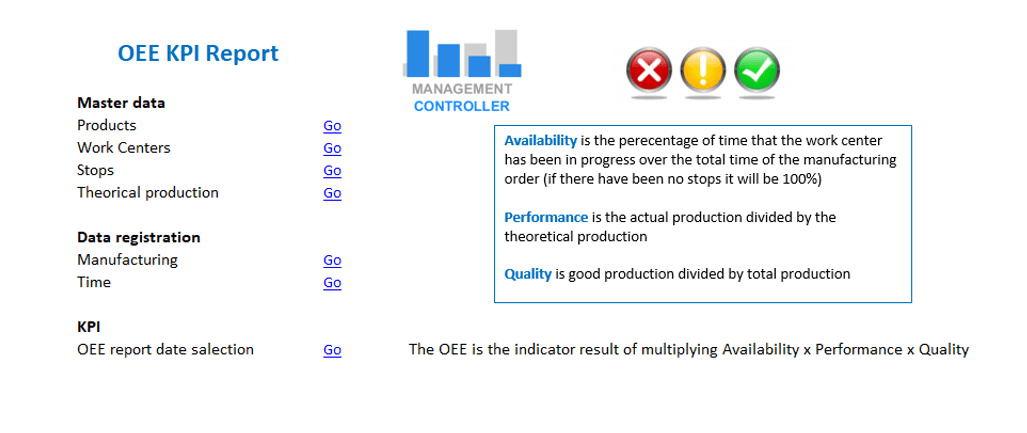
We have 2 types of data inputs, production and time.
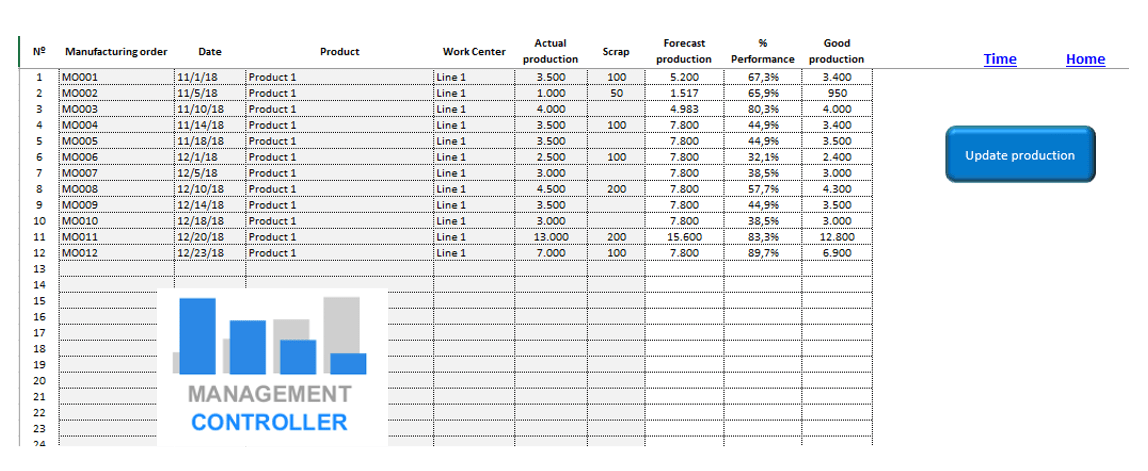
In the entry of production data, the manufacturing Order Number, the date of manufacture, the manufactured product, the line or equipment in which it was manufactured, the actual production and the waste or scrap are entered.
This information is used to calculate performance and quality indicators.
Currently the template is prepared to register up to 500 manufacturing orders, but it can be expanded to whatever is needed.
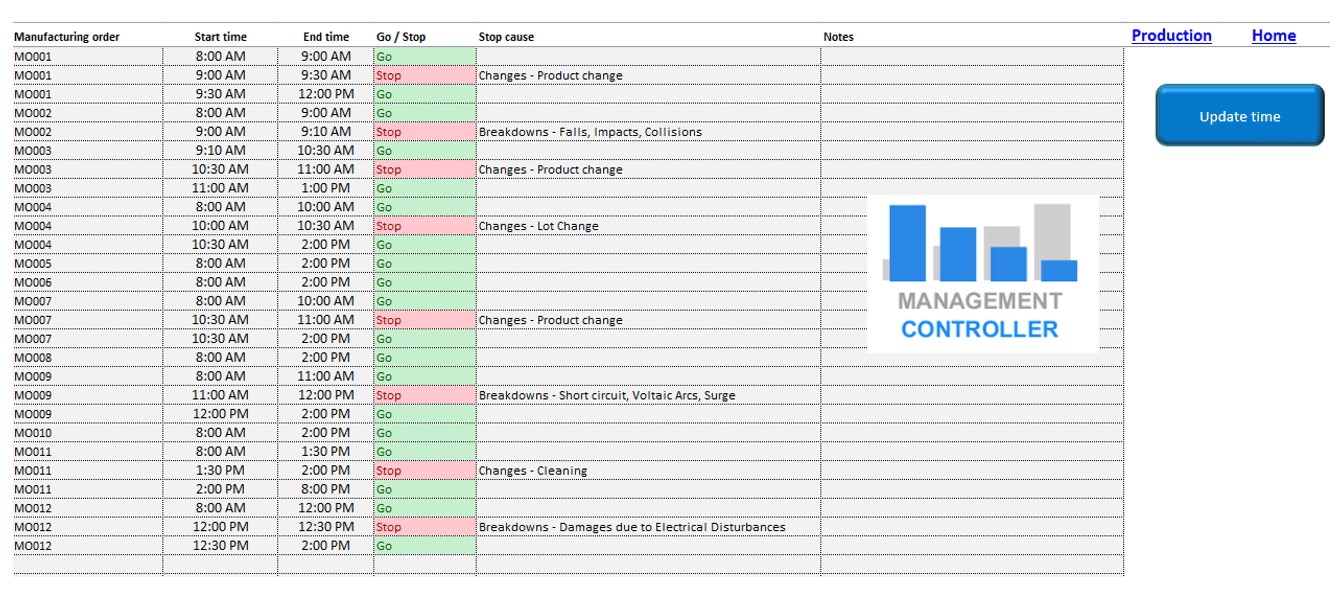
In the time data entry, the manufacturing order is selected and the start and end times are recorded whether the machine is running or stopped.
In the event that there was a stoppage, the cause of the stoppage would be selected.
With this information, the availability indicator is calculated.
Currently the template is prepared to record up to 1,000 time lines, but it is expandable to whatever is needed.
Excel is a powerful and versatile tool for managing an organization’s key performance indicators (KPIs). It can be used for almost any type of analysis, and it has a multitude of functions that will help you visualize and measure the performance of your company. Especially when it comes to overall equipment effectiveness (OEE), Excel can be a great resource for identifying areas for improvement and optimizing operations.
What is KPI OEE Manufacturing?
OEE Manufacturing KPI is a tool used to measure the overall efficiency and effectiveness of all equipment used in a manufacturing process.
It takes into account both production performance and product quality, as well as other factors such as availability and throughput.
By calculating the OEE Manufacturing KPI, organizations can gain insight into the effectiveness of their operations and overall production efficiency.
Benefits of using Excel for the OEE Manufacturing KPI
Using Excel for the OEE Manufacturing KPI can be highly beneficial to organizations, allowing them to quickly and easily create detailed reports, visualize key performance metrics, and identify areas for improvement.
Furthermore, Excel is a very powerful and versatile tool, so it can be used for a wide variety of tasks, from forecasting to financial modelling.
Organizations can also create Excel templates that can be reused for similar projects, saving time and money.
Use Excel to improve OEE Manufacturing
In addition to using Excel to create KPI reports, organizations can also use Excel to improve their OEE Manufacturing.
By creating a simulator in Excel, organizations can generate different scenarios to compare with actual results.
This can help them identify pain points in their operations and develop solutions to address these problems.
Excel can also be used to track the performance of each employee, so that managers can identify strengths and areas that need improvement.
What savings and improvements can you achieve with the OEE KPI
OEE, or Overall Equipment Effectiveness, is a measure that tracks the effectiveness of a production process.
It is made up of three main metrics: availability, performance, and quality.
Availability measures how often the computer works, while performance measures how quickly the computer can complete a task.
Quality measures how consistently the team performs at a high level.
By evaluating these three metrics, you can get a clear idea of the efficiency of your production process.
By monitoring the OEE, you can see where improvements are needed and where you can save money.
For example, if the availability metric is low, it means that your equipment is not working as often as it should, which means that you are wasting time and resources.
With OEE, you can identify where your production process needs to be improved to run more efficiently and save money.
The 3 OEE indicators Excel Report:
Availability is the perecentage of time that the work center has been in progress over the total time of the manufacturing order (if there have been no stops it will be 100%)
Performance is the actual production divided by the theoretical production
Quality is good production divided by total production
The OEE is the indicator result of multiplying Availability x Performance x Quality
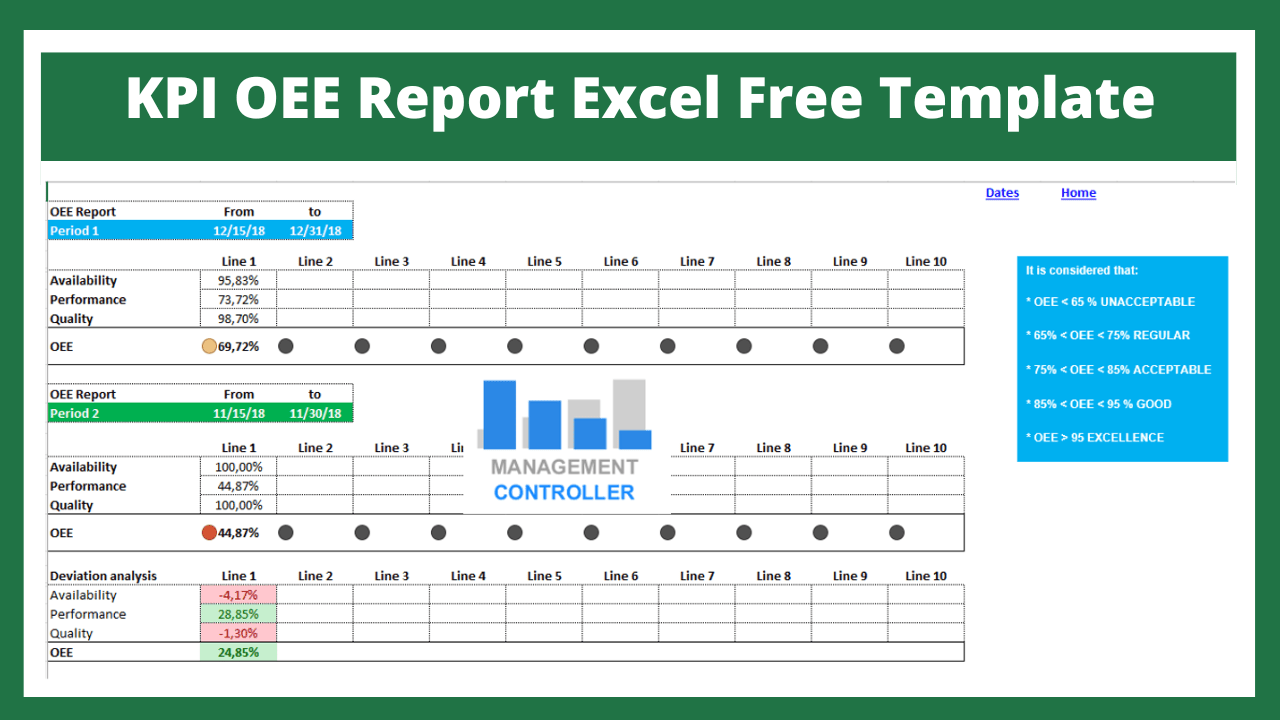
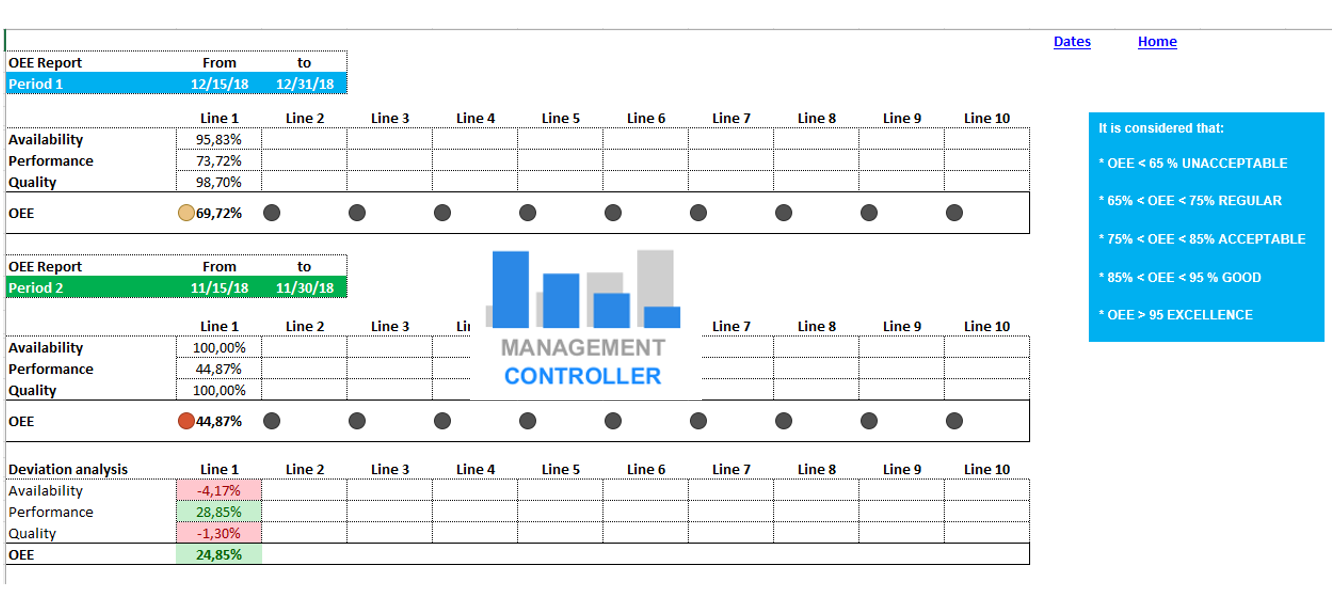
Once the manufacturing data and times have been completed, we can carry out the analysis, in the analysis of the OEE report we can select 2 periods to be able to compare them, in each period we select a start date and an end date and finally execute the OEE report.
In the report we have the Availability indicators in %. Performance and Quality and the OEE for the selected periods and a comparison between both periods to analyse differences and evaluate the variations.
The OEE indicator has colored alerts like traffic lights, these parameters are modifiable.
- Currently less than 65% is shown in red.
- Between 65% and 85% shows yellow.
- Above 85% is displayed in green.
- And if there is no data or the OEE is zero, it is shown in black.
It is usual to consider the OEE report with the following perspective.
- OEE < 65% UNACCEPTABLE
- 65% < OEE < 75% REGULAR
- 75% < OEE < 85% ACCEPTABLE
- 85% < OEE < 95% GOOD
- OEE > 95 EXCELLENCE
Additionally, an analysis of stopped hours can be carried out on each line for the selected periods, which shows the total hours stopped for each cause and the percentage that each cause represents of the total hours stopped.
Images KPI OEE Report Excel Free Template
Excel can be a powerful tool for managing OEE Manufacturing KPIs as well as improving overall operations. It’s versatile, easy to use, and can help organizations identify areas for improvement, visualize key performance metrics, and forecast results. Organizations can also create templates in Excel to use for similar projects, saving them time and money. So whether you’re just getting started with OEE Manufacturing KPIs or trying to improve your current processes, Excel will certainly be a great resource.
Nur Farahin Hajini (Production engineer)
From my observation I found out that the template was great! The interconnection between availability, performance, quality and other factors are clearer. It does help me a lot to get a better insight on OEE in Excel.

Use the following FREE template for 2 months, once the expiration date is over, you will have to download it again to be able to use it time after time.
More information about Controlling Excel Tools
- How the Budget Control service works
- Human Resources Excel Templates
- Pipeline CRM Excel spreadsheet
- Excel Template Balanced Scorecard PRO M2
- Excel Template Matrix for Decisions
- Inventory Control and Dashboard Excel Template
- Marketing Plan Free Excel Template
- Human Resources HR Budget Excel Template
- Home Budget M2 Excel Template
- Excel Budget BOM Manufacturing Costs and Margins M15
- Budgetary control System with Projections example
- CRM Excel Template M3 PRO
- Real Estate Excel Templates
- Project Management Excel Templates
- Excel Template Cash Flow Forecast M15
- Documents Management Free Excel Template M1
- Multiproducts Breakeven Simulator Free Excel Template
- How to Calculate the Unit Cost of a Product
- Planning Purchase Orders Excel report with ODOO data
- How to know how much money your company will earn at the end of the year
- FREE Excel Balanced Scorecard 2KM15
- Decisions Sale Price Lists Calculation Free Excel Template
More Videos about Management Accounting
![]()

Industrial company financial manager
Dani is helping us to use ODOO more efficiently, we are rapidly leveling up with the ERP. It is also preparing us very useful analysis and control reports and outstanding management tools. Always available by phone or email, willing to help and collaborate in everything that is proposed. Very professional and fast work. A key service for our company.
Controlling Consultant
Controller ODOO ERP

Email: dani@cashtrainers.com