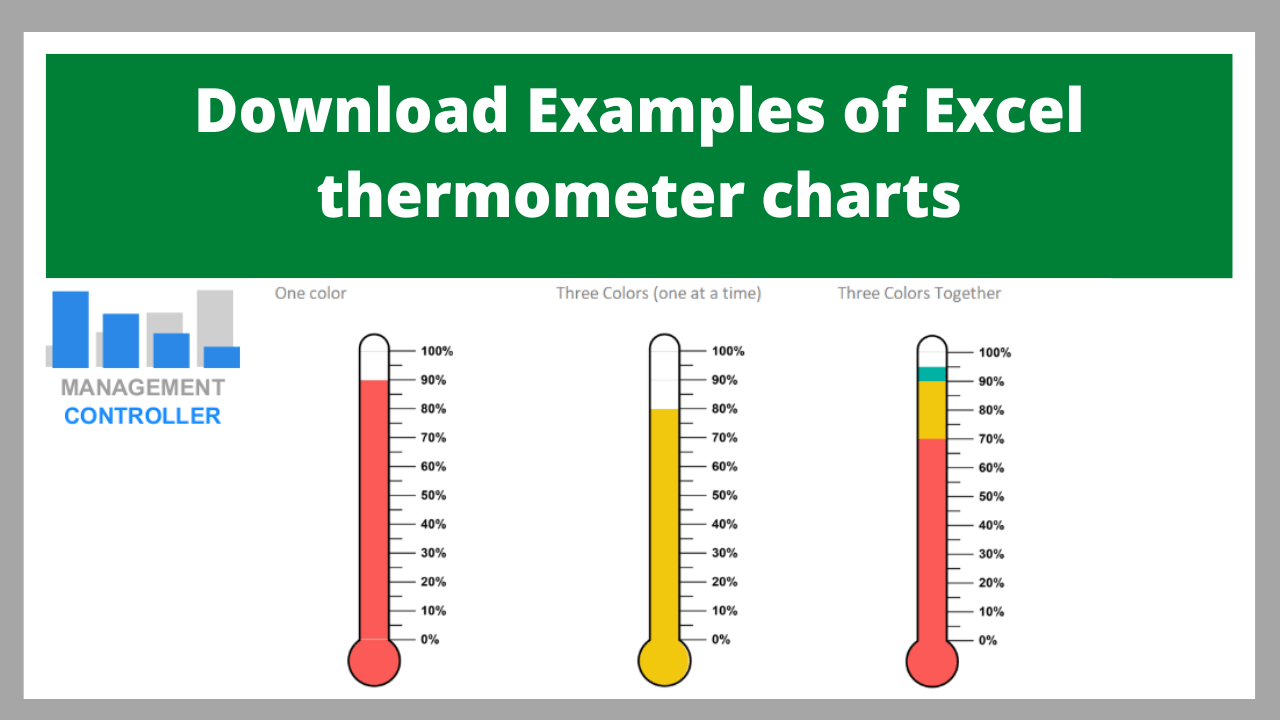
Download Example of Excel thermometer chart.
Excel thermometer charts are a useful tool for keeping a visual record of progress made toward a certain objective.
These charts are gaining popularity among companies and organizations that need to efficiently and plainly communicate progress to a large audience.
Because of the visual character of thermometer charts, which sets them apart from other kinds of data visualization, these charts are an excellent option for displaying high-level information.
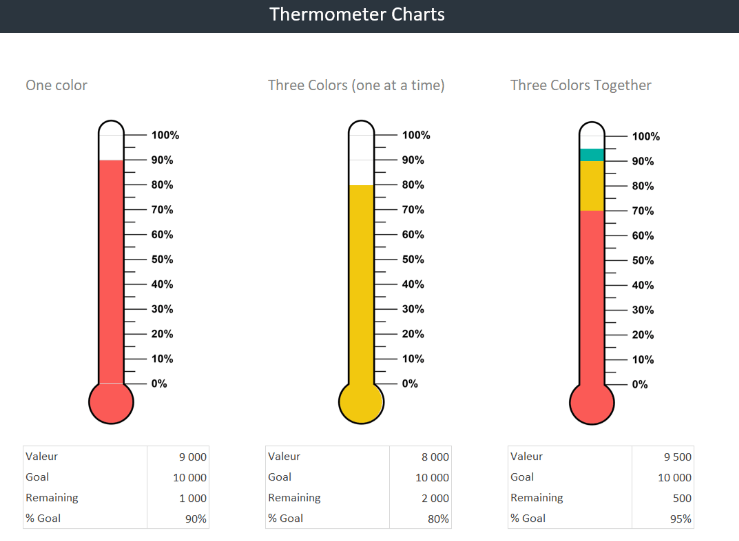
Up to three indicators may be plotted on this thermometer-style chart provided as a template for Excel by Microsoft.
You may use this thermometer chart on other dashboards, or you can learn how to construct a thermometer chart using an image by following the instructions provided here.
It’s a fantastic strategy for enhancing the effectiveness of your business communications!
Principal Attributes
Stunning thermometers that may be used to highlight performance indications
Create your own own visual boards quickly and easily with the help of our charts.
Spread the word to everyone about the performance metrics that are in place, and be sure to recognize any and all successes.
Put these thermometers to use on some of the other dashboards.
Become familiar with the process of creating a thermometer chart in Excel.
Do you need to get this Excel Template?
Press the next button and follow the instructions.
Press here to get this templatePerhaps you may also be interested in:
Excel Template Financial KPIs Dashboard
Dashboard Layout Excel Templates
Digital Marketing Dashboard Control M1 Free Excel Template
Excel Templates Financial Dashboards Pack
Inventory Control and Dashboard Excel Template
FREE Excel Balanced Scorecard 2KM15
Free Excel Template KPIs Dashborad
More information about Controlling Excel Tools
- Best Finance Excel Templates for Controlling and Management
- Does a company need to automate or optimize administrative tasks?
- Wedding Budget Control M1 Free Excel Template
- Excel Template Financial KPIs Dashboard
- Working Hours Timesheet Free Excel Template
- Training Courses Control Free Excel Template
- E-Commerce KPIs Control Excel Template
- Projects Control with Tasks Free Excel Template
- Excel Template Employee Training Control
- Inventory Turnover and Coverage Calculation Free Excel Template
- Budget Control for Events M1 Excel Template
- What is an Excel Action Plan template and how can it help you?
- KPI Sales and Commissions Control Excel Template
- Tracking Shipments Excel Template
- Payments Forecast Control FREE Excel Template
- How to Calculate the Unit Cost of a Product
- Why CASH is important in companies, CASH is King
- Payments Due Date Control Free Excel Template
- Dashboard Layout Excel Templates
- Warehouse Inventory Control Free Excel spreadsheet
- KPIs Management Excel Templates
- Management Budget Control Easy Theory Difficult Implementation
More Videos about Management Accounting
![]()

Industrial company financial manager
Dani is helping us to use ODOO more efficiently, we are rapidly leveling up with the ERP. It is also preparing us very useful analysis and control reports and outstanding management tools. Always available by phone or email, willing to help and collaborate in everything that is proposed. Very professional and fast work. A key service for our company.
Controlling Consultant
Controller ODOO ERP

Email: dani@cashtrainers.com